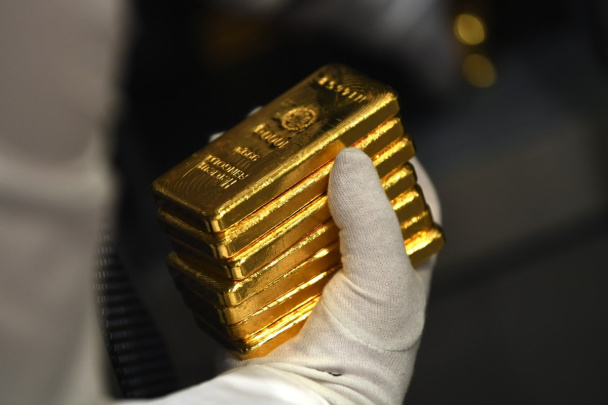
Due to the supply of gold and chemical industry products, the trade deficit was slightly reduced.
The foreign trade turnover of Uzbekistan in January-April reached $20.87 billion. Compared to last year, it increased by almost 6%, according to the report of the Statistics Agency.
The volume of exports increased by 9% and amounted to $8.49 billion, while imports increased only by 3.9% to $12.37 billion. The foreign trade deficit decreased slightly compared to last year and amounted to $3.88 billion.
Of the $2.1 billion in export revenue for April, gold sales provided more than a third, or $758.3 million. Since the beginning of the year, exports of the precious metal amounted to $3.42 billion, an increase of 11.8% over the year.
The first place in trade turnover with Uzbekistan remains with China – $3.96 billion, of which $3.31 billion was provided by Chinese exports. In second place with $3.84 billion is Russia, which remained the main export market for Uzbekistan ($1.02 billion).
The top 5 included Kazakhstan ($1.22 billion), Turkey ($920.2 million) and South Korea ($695 million). Trade with France ($386.4 million) increased by half, with exports more than doubling ($264.6 million).
Export
In addition to gold, manufactured goods remain the main commodity export for the country. Since the beginning of the year, revenue from their supplies reached $1.34 billion, or 3.1% more than last year.
Revenue from exports of textiles and fabrics increased by 3.5% and amounted to $704.2 million. Supplies of non-ferrous metals rose by 7% to $447.6 million, while exports of steel and cast iron decreased slightly ($69.9 million).
The volume of exports of chemical products amounted to $488.1 million (+31.8%). Inorganic substances showed more than 80% growth – up to $283.4 million, while fertilizer supplies slightly exceeded last year ($78.4 million, +1.2%).
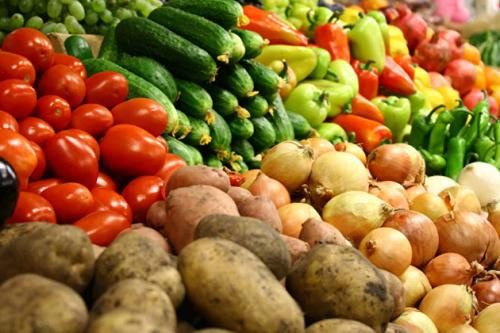
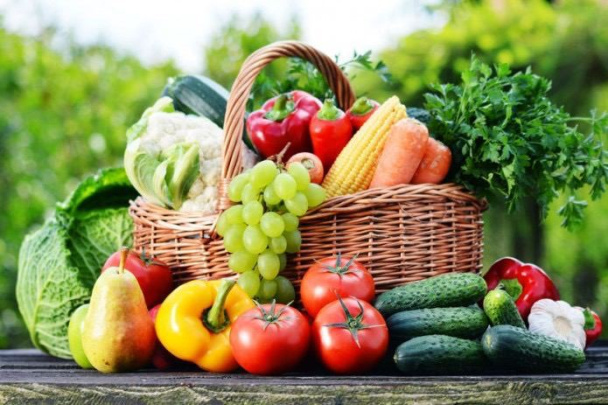
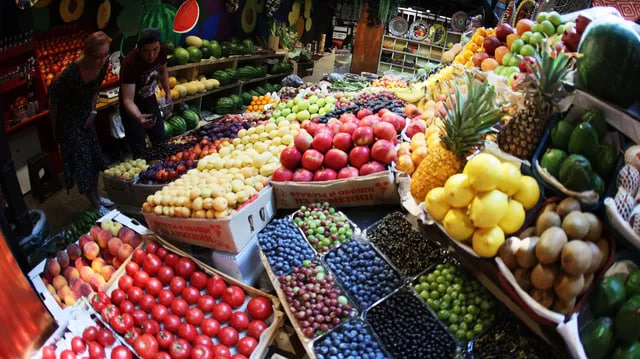
Third place was taken by food exports with $473.7 million (+0.1%). Vegetables and fruits ($303 million, +13%), as well as grains ($128.3 million, -23.5%) continue to dominate here.
Exports of consumer goods amounted to $347.5 million (-6.6%). Revenue from clothing supplies amounted to $293.4 million (-6.7%), while for special devices it grew by 60% (to $5.6 million), for furniture - by 18.2% (to $5.6 million) .
For engineering products, the decline was 15.2% with a total volume of $319.5 million. Exports of cars and parts for them decreased again, amounting to $120 million in four months.
The supplies of generators ($41.7 million, -12.2%), electrical equipment ($64.3 million, -14.8%), telecommunications and sound recording equipment ($27.1 million, -45.7%), equipment for data processing ($3.8 million, 4 times). At the same time, supplies of metalworking machines increased by almost 40% ($1.3 million).
Supplies of hydrocarbons increased by 2.7 times (to $179.4 million), metal ores – by 7.9 times ($17.4 million). On the other hand, gas exports fell by more than half ($52.3 million).
Import
In the structure of imports of goods, engineering products lead the way with $4.55 billion (-3.8%). Supplies of automobiles and components amounted to $1.18 billion (-7.5%), electrical equipment – $603 million (+58.5%), communication devices – $302 million (-1.3%), computer equipment – $162 million (+11 %).
Second place is occupied by manufactured goods - $1.97 billion (+7.8%). In this category, imports increased significantly for iron and steel ($914.3 million, +19.6%), wood products ($125 million, +18%) and non-ferrous metals ($107 million, +8.3%).
Imports of chemical industry products decreased by 2.9% – to $1.53 billion. Costs for medical goods amounted to $635.4 million (+21.3%), for plastics – $233.5 million (-16%).
Supplies of fuel and fuels and lubricants amounted to $1.38 billion. Imports of natural gas (from Russia and Turkmenistan) tripled to $462.8 million. Costs for coal amounted to $63.3 million (+15.7%), oil and petroleum products – $788.3 million (+26.8%).
Imports of foreign food amounted to $1.127 billion (-5%). The supply of grain products amounted to $293.4 million (-33.6%), vegetables and fruits - $180.7 million (+45.3%), sugar and confectionery – $177.6 million (-5.6%).