

Additional features
-
Night mode
Uzbekistan boosts food and electricity exports while textile and car shipments decline
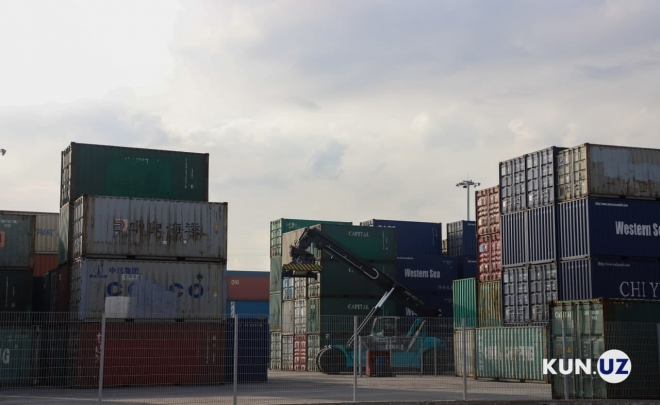
Uzbekistan’s foreign trade expanded sharply in January–November 2025, driven by strong export growth, while the structure of trade shifted toward food products and energy and away from textiles and automobiles.
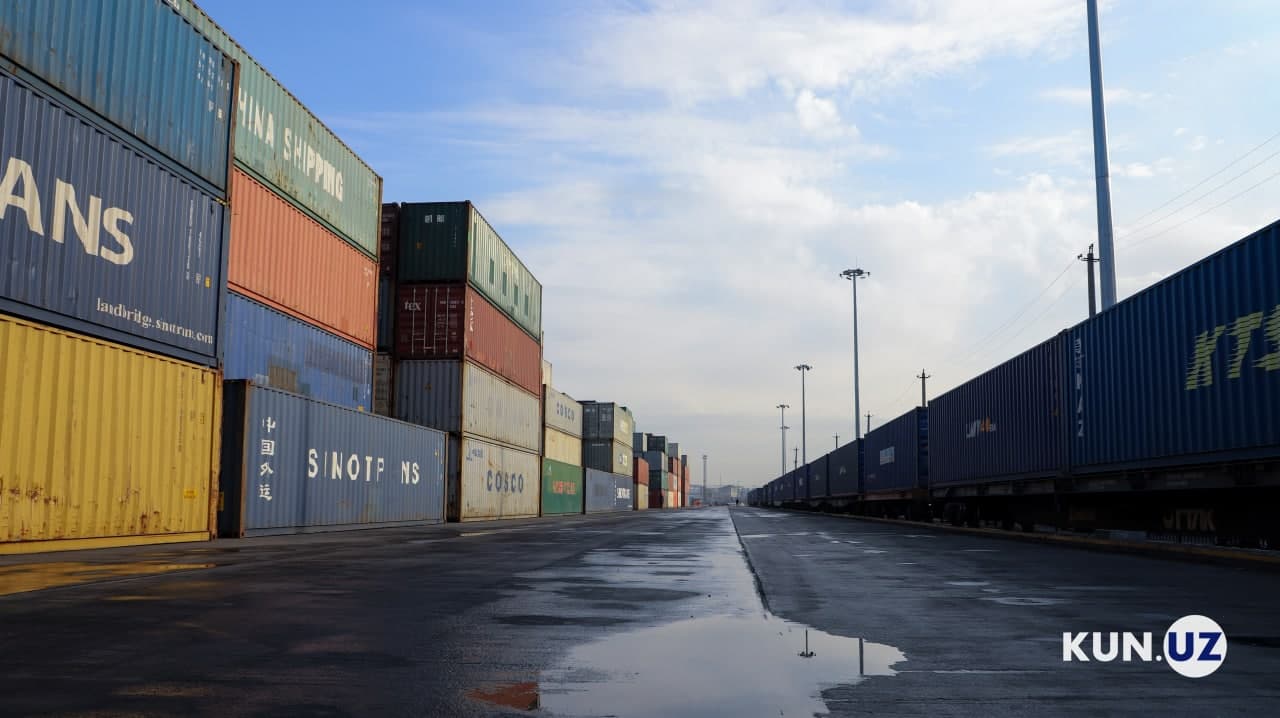
According to data from the National Statistics Committee, during the first 11 months of the year, Uzbekistan’s total foreign trade turnover reached $72.78 billion, up 21.8 percent year on year. Exports rose to $30.8 billion, an increase of 26.2 percent, while imports grew by 16.9 percent to $41.88 billion. As a result, the trade deficit widened slightly to $10.99 billion, compared with $10.78 billion a year earlier.
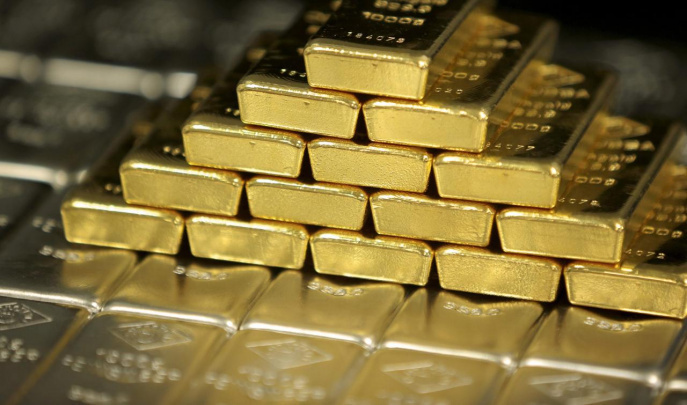
In November, Uzbekistan fully suspended gold sales. Despite this pause, gold exports totaled $9.9 billion over January–November, up 49.4 percent year on year and surpassing the previous record of $8.15 billion set in 2023.
China remained Uzbekistan’s largest trading partner, with bilateral trade reaching $14.64 billion, followed by Russia at $11.79 billion. Trade with China increased by 30.1 percent, while trade with Russia grew by 10.9 percent. Kazakhstan ranked third with $4.36 billion, ahead of Turkey at $2.68 billion and South Korea at $1.56 billion. Other major partners included Afghanistan ($1.47 billion), France ($1.24 billion), India ($1.2 billion), Germany ($1.16 billion), and the United Arab Emirates ($1.12 billion).
Exports
Excluding gold, industrial goods remained the largest export category, although revenues declined by 10.2 percent to $3.49 billion. Textile and fabric exports fell sharply to $1.4 billion, down 23.8 percent, while shipments of non-ferrous metals edged down to $1.3 billion, a decrease of 6.9 percent. At the same time, exports of non-metallic mineral products rose to $272.7 million, metal products to $197.5 million, and pig iron and steel to $182.4 million.
Food products ranked second, totaling $2.68 billion, a 36.2 percent increase. Exports were dominated by fruits and vegetables at $2.01 billion, up 39.1 percent, and cereals at $501.3 million, up 41.8 percent.
Chemical exports reached $1.86 billion, growing by 19.2 percent. Inorganic chemicals increased by 21.3 percent to $1.04 billion, while fertilizer exports rose by 33.7 percent to $426 million.
Exports of various finished goods surged to $1.54 billion, up 52.9 percent. Clothing exports amounted to $936.6 million, an increase of 18.7 percent, while exports classified as “other finished goods” jumped 3.5 times to $538.9 million.
Fuel and energy exports grew by 13.7 percent to $1.38 billion. Natural gas exports reached $624.1 million, up 5.2 percent, while oil and petroleum products totaled $604.5 million, up 15.2 percent. Electricity exports increased by more than half, exceeding $152.2 million.
By contrast, exports of machinery and equipment declined by 10.4 percent to $987.7 million. Car exports fell by 24.7 percent to $282.2 million, while exports of electrical equipment rose to $247.5 million, an increase of 30.7 percent. Shipments of automotive parts and accessories dropped by 11.7 percent to $240.7 million.
Service exports reached $8.47 billion, accounting for 27.4 percent of Uzbekistan’s total exports. This segment expanded by 28.9 percent year on year, led by tourism at $4.52 billion, transport at $2.63 billion, and IT services at $666.8 million.
Imports
Machinery and equipment dominated imports, totaling $14.05 billion, up 15 percent. Imports included vehicles worth $3.27 billion, special-purpose machinery at $2.78 billion, industrial non-specialized equipment at $2.23 billion, electrical equipment at $2.2 billion, power generators at $1.35 billion, and sound recording equipment at $974 million.
Since the start of the year, passenger car imports dropped by 13.8 percent to $1.02 billion. At the same time, imports of automotive parts and accessories jumped by 37.5 percent to $1.61 billion.
Industrial goods ranked second among imports at $6.56 billion, up 18.8 percent. Imports of pig iron and steel rose to $2.84 billion, metal products to $982.1 million, textile yarn to $552.3 million, and rubber products to $523.7 million.
Chemical imports increased by 19.1 percent to $5.09 billion. Spending on medical products reached $1.82 billion, primary plastics $965.9 million, and chemical materials $664.6 million.
Food imports exceeded $4 billion, up 20 percent. Grain imports totaled $919.5 million, while meat and meat products surged by 68.5 percent to $761.7 million. Imports of sugar and confectionery declined by 10.7 percent to $509.3 million, while coffee, tea, cocoa, spices, and related products rose to $457.9 million.
Imports of fuel and energy resources remained broadly unchanged at $3.54 billion. Oil and petroleum product imports held steady at $1.8 billion, gasoline imports rose by 5.3 percent to $1.39 billion, and gas imports from Turkmenistan and Russia fell by 1.2 percent to $1.45 billion. Coal imports increased to $187.4 million, while electricity imports declined to $95.8 million.
Service imports, which accounted for 10.8 percent of total imports, grew by 32.2 percent to more than $4 billion. Tourism led the segment with $2.08 billion, followed by transport at $815.7 million and IT services at $444.6 million.

Related News
15:41
Decline in gold prices pushes Uzbekistan's reserves down by $6.8 billion
11:15
IMF reclassifies Uzbekistan's exchange rate as “floating”
15:56 / 07.07.2026
Remittances to Uzbekistan rise 13% despite falling share from Russia
11:35 / 07.07.2026